Humanities, Social Science and Language


Digital Products


Connect®
Course managementreporting, and student learning tools backed by great support.

McGraw Hill GO
Greenlight learning with the new eBook+

ALEKS®
Personalize learning and assessment

ALEKS® Placement, Preparation, and Learning
Achieve accurate math placement

SIMnet
Ignite mastery of MS Office and IT skills

McGraw Hill eBook & ReadAnywhere App
Get learning that fits anytime, anywhere

Sharpen: Study App
A reliable study app for students

Virtual Labs
Flexible, realistic science simulations

AI Reader
Encourage Discovery, Boost Understanding

Services


Affordable Access
Reduce costs and increase success

LMS Integration
Log in and sync up

Content Collections powered by Create®
Curate and deliver your ideal content

Custom Courseware Solutions
Teach your course your way

Education for All
Let’s build a future where every student has a chance to succeed

Business Program
Explore business learning solutions & resources

Professional Services
Collaborate to optimize outcomes

Remote Proctoring
Validate online exams even offsite

Institutional Solutions
Increase engagement, lower costs, and improve access for your students

Evergreen
Updated, relevant materials—without the hassle.

Support


General Help & Support Info
Customer Service & Tech Support contact information

Online Technical Support Center
FAQs, articles, chat, email or phone support

Support At Every Step
Instructor tools, training and resources for ALEKS, Connect & SIMnet

Instructor Sample Requests
Get step by step instructions for requesting an evaluation, exam, or desk copy

Platform System Check
System status in real time

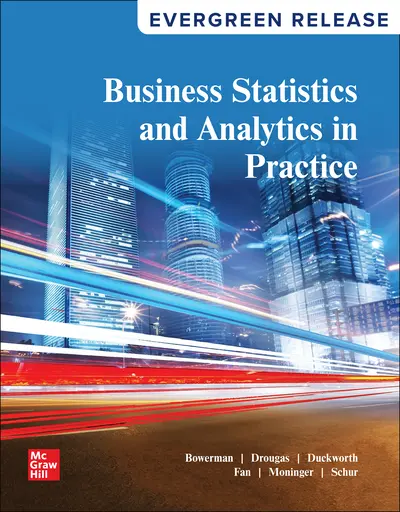
Business Statistics and Analytics in Practice

ISBN10: 1260187497 | ISBN13: 9781260187496

Business Statistics and Analytics in Practice
ISBN10: 1260187497
ISBN13: 9781260187496
By Bruce Bowerman, Anne M. Drougas, William M. Duckworth, Amy G. Froelich, Ruth M. Hummel, Kyle B. Moninger and Patrick J. Schur

* The estimated amount of time this product will be on the market is based on a number of factors, including faculty input to instructional design and the prior revision cycle and updates to academic research-which typically results in a revision cycle ranging from every two to four years for this product. Pricing subject to change at any time.

Instructor Information

Quick Actions (Only for Validated Instructor Accounts):

Bowerman 9e covers both standard business statistics and business analytics topics and provides them in a clear presentation that is organized so that business analytics topics may be used or not used. Bowerman provides a continuous case throughout chapters and business analytics topics that allow students to use data for a more applied and practical approach. Featuring Connect, Smartbook, Guided examples, Algorithmic Problems and a Business Statistics, Math and Excel prep component, Bowerman is a perfect fit for the instructor who wants a Business Stats with Business Analytics focus.

Chapter 1 An Introduction to Business Statistics and Analytics
Chapter 2 Descriptive Statistics and Analytics: Tabular and Graphical Methods
Chapter 3 Descriptive Statistics and Analytics: Numerical Methods
Chapter 4 Probability and Probability Models
Chapter 5 Predictive Analytics I: Trees, k-Nearest Neighbors, Naive Bayes’, and Ensemble Estimates
Chapter 6 Discrete Random Variables
Chapter 7 Continuous Random Variables
Chapter 8 Sampling Distributions
Chapter 9 Confidence Intervals
Chapter 10 Hypothesis Testing
Chapter 11 Statistical Inferences Based on Two Samples
Chapter 12 Experimental Design and Analysis of Variance
Chapter 13 Chi-Square Tests
Chapter 14 Simple Linear Regression Analysis
Chapter 15 Multiple Regression and Model Building
Chapter 16 Predictive Analytics II: Logis¬tic Regression, Discriminate Analysis, and Neural Networks
Chapter 17 Time Series Forecasting and Index Numbers
Chapter 18 Nonparametric Methods
Chapter 19 Decision Theory
Chapter 20 (Online) Process Improvement Using Control Charts for Website
Appendix A Statistical Tables
Appendix B (Online) Chapter by Chapter MegaStat Appendices

About the Author

Bruce Bowerman

Bruce L. Bowerman is professor of decision sciences at Miami University in Oxford, Ohio. He received his Ph.D. degree in statistics from Iowa State University in 1974, and he has over 40 years of experience teaching basic statistics, regression analysis, time series forecasting, survey sampling, and design of experiments to both undergraduate and graduate students. In 1987, Professor Bowerman received an Outstanding Teaching award from the Miami University senior class, and in 1992 he received an Effective Educator award from the Richard T. Farmer School of Business Administration. Together with Richard T. O’Connell, Professor Bowerman has written 16 textbooks. These include Forecasting and Time Series: An Applied Approach; Forecasting, Time Series, and Regression: An Applied Approach (also coauthored with Anne B. Koehler); and Linear Statistical Models: An Applied Approach. The fi rst edition of Forecasting and Time Series earned an Outstanding Academic Book award from Choice magazine. Professor Bowerman has also published a number of articles in applied stochastic processes, time series forecasting, and statistical education. In his spare time, Professor Bowerman enjoys watching movies and sports, playing tennis, and designing houses.

Anne M. Drougas

Anne M. Drougas is a Professor of Finance and Quantitative Methods at Dominican University in River Forest, Illinois. Over the course of her academic career, she has received three teaching awards and has developed and taught online and hybrid business statistics and finance courses. Her research is primarily in the areas of corporate finance, simulation, and business analytics with publications in a number of journals including the Journal of Financial Education and Journal of Applied Business and Economics. She spends her spare time with her family and serving on the board of directors for Hephzibah House, a social service agency for children in Oak Park, Illinois.

William M. Duckworth

William M. Duckworth specializes in statistics education and business applications of statistics. His professional affiliations have included the American Statistical Association (ASA), the International Association for Statistical Education (IASE), and the Decision Sciences Institute (DSI). Dr. Duckworth was also a member of the Undergraduate Statistics Education Initiative (USEI), which developed curriculum guidelines for undergraduate programs in statistical science that were officially adopted by the ASA. Dr. Duckworth has published research papers, been an invited speaker at professional meetings, and taught company training workshops, in addition to providing consulting and expert witness services to a variety of companies. During his tenure in the Department of Statistics at Iowa State University, his main responsibility was coordinating, teaching, and improving introductory business statistics courses. Dr. Duckworth currently teaches business analytics to both undergraduate and graduate students in the Heider College of Business at Creighton University.

Amy G. Froelich

Amy G. Froelich received her Ph.D. in Statistics from the University of Illinois, Urbana-Champaign, and currently is Associate Professor and Director of Undergraduate Education in the Department of Statistics at Iowa State University. A specialist in undergraduate statistics education, she has taught over 2,700 students at Iowa State in the last 18 years, primarily in introductory statistics, probability and mathematical statistics, and categorical data analysis. Her research in statistics education and psychometrics and educational measurement has appeared in The American Statistician, the Journal of Statistics Education, Teaching Statistics, and the Journal of Educational Measurement, and she and her colleagues have received research funding from the National Science Foundation, the U.S. Department of Agriculture, and the U.S. Department of Education. Dr. Froelich has received several teaching and advising awards at Iowa State University and was the 2010 recipient of the Waller Education Award from the American Statistical Association. When not working, she enjoys reading, spending time with her family, and supporting her daughters’ extracurricular activities.

Ruth M. Hummel

Ruth M. Hummel is an Academic Ambassador with JMP, a division of SAS specializing in desktop software for dynamic data visualization and analysis. As a technical advocate for the use of JMP in academic settings, she supports professors and instructors who use JMP for teaching and research. She has been teaching and consulting since 2002, when she started her career as a high school math teacher. She has taught high school, undergraduate, and graduate courses in mathematics and statistics, and directed statistical research and analysis in a variety of fields. Ruth holds a Ph.D. in statistics from Pennsylvania State University.

Kyle B. Moninger

Kyle B. Moninger instructs the Quantitative Business Curriculum at Bowling Green State University in Bowling Green, Ohio. He teaches and plans undergraduate courses in statistics and business calculus, serves on the Quantitative Business Curriculum committee, and supervises the college’s math and statistics tutoring center. Kyle has been a visiting instructor three times at Tianjin Polytechnic University in Tianjin, China, and was previously a data scientist at Owens Corning in Toledo, Ohio, where he designed and implemented a corporate training program on business intelligence and analytics.  

Patrick J. Schur

Patrick J. Schur is a Senior Clinical Professor in the Department of Information Systems and Analytics in the Farmer School of Business at Miami University in Oxford, Ohio. He received his master’s degree in statistics from Purdue University. He has been at Miami University for 11 years, teaching introductory statistics courses and advanced statistics courses including regression modeling, time series modeling, design of experiments, and statistical process control. Before joining Miami University, he worked at Procter & Gamble as a statistical consultant and also worked with multiple startup companies cutting across multiple industries.
Accessibility

Creating accessible products is a priority for McGraw Hill. We make accessibility and adhering to WCAG AA guidelines a part of our day-to-day development efforts and product roadmaps.

For more information, visit our accessibility page, or contact us at accessibility@mheducation.com

Need support?   We're here to help - Get real-world support and resources every step of the way.

Top